Wildlife history & conservation
What Happened to the Wildebeest Migration in Nairobi National Park?
Nairobi’s historic migration did not vanish in a single event. Its open seasonal landscape was progressively divided until only a small, irregular remnant movement remained.
Evidence review last fact-checked
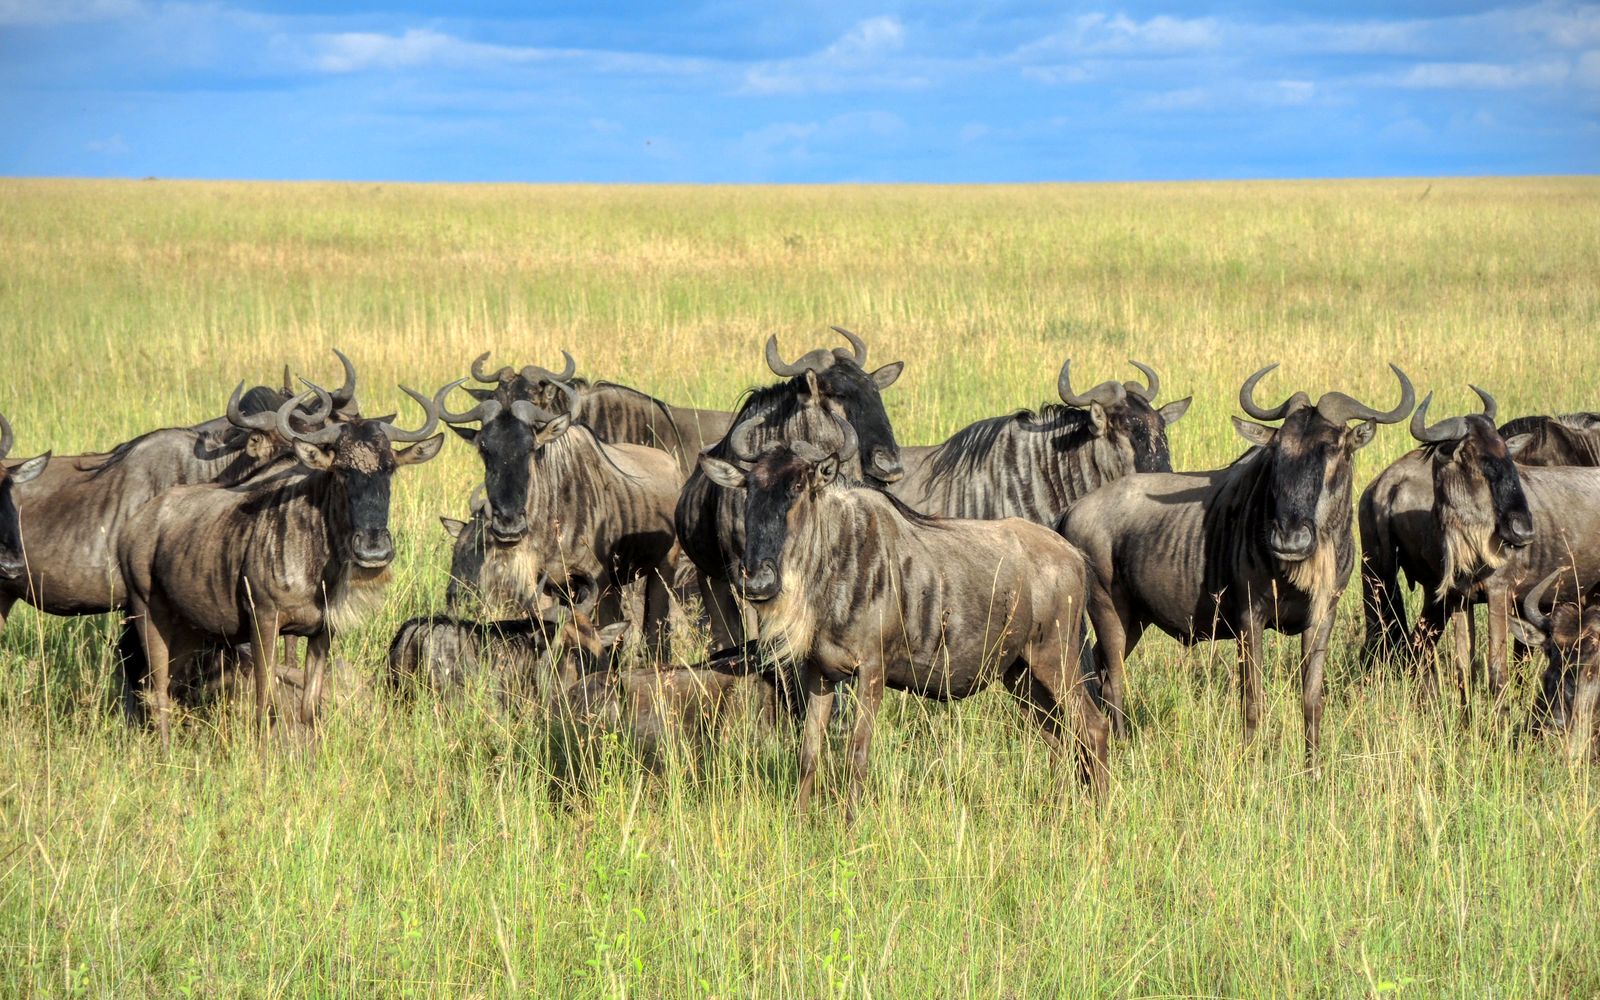
Nairobi National Park’s historic wildebeest migration has not disappeared completely, but it has functionally collapsed. Tens of thousands once moved seasonally between the park’s dry-season refuge and the Athi-Kapiti plains. Land subdivision, fencing, roads, settlement, industry and poaching fragmented that range. Today, only a small and irregular remnant movement survives, principally southeast of the park.
That conclusion does not mean wildebeest are extinct in Nairobi National Park. Animals still occur in the park and the wider ecosystem, but their numbers, range and freedom to complete seasonal journeys are far below historic levels. For the wider wildlife context, see the guide to animals found in Nairobi National Park.
Quick answer
The short answer at a glance
| Question | Evidence-based answer |
|---|---|
| What happened? | The former large, regular migration became a small, irregular and spatially restricted movement. |
| Why did it decline? | The strongest evidence points to loss and fragmentation of wet-season range through subdivision, fences, settlement, roads, industry and other land-use change. Poaching, drought, livestock pressure and habitat condition compounded the decline. |
| Where did the animals move? | Primarily between Nairobi National Park, which served as a dry-season refuge, and the Kitengela–Athi-Kapiti plains to the south and southeast. Older records describe a much larger connected range. |
| When did they move? | Wildebeest generally dispersed onto the plains during rainy periods and concentrated in or near the park in the late dry season, historically peaking around August–October. Rainfall variability meant the timing was never a fixed calendar event. |
| Do they still migrate? | Some seasonal movement persists, especially in the southeastern part of the ecosystem, but there is no longer a secure, fully functional route supporting the former mass migration. |
| Can visitors still see wildebeest? | Yes, but sightings and herd size are variable. Nairobi should not be promoted as a predictable mass-migration destination. |
Explore the evidence
From historic range to possible recovery
Use the tabs to move through the former route, the causes of decline, the ecosystem that remains, conservation responses and practical visitor expectations.
History and route
This was not the Serengeti–Mara Great Migration
The Nairobi–Athi-Kapiti wildebeest migration was a separate ecological system from the famous circular migration through Tanzania’s Serengeti and Kenya’s Maasai Mara. Nairobi’s herds moved within the Athi-Kapiti ecosystem, using the national park and adjoining rangelands as complementary seasonal habitats.
Calling it a “migration” is still correct: it involved repeated, directional seasonal movement between distinct ranges. However, it was not a river-crossing spectacle or part of the Serengeti herd. This distinction answers a common source of confusion in searches for “wildebeest migration near Nairobi.”
How extensive was the historic migration?
Nairobi National Park was the northern dry-season refuge of a much larger open savanna system. The park covers only about 117 square kilometres, so it could not sustain the historic herds in every season. In rainy periods, animals spread south across the Mbagathi River into the Kitengela and Athi-Kapiti plains, where short new grass, temporary water and calving habitat became available. As surface water and forage declined, many returned toward the better-watered park.
The movement was not a single narrow trail. It was a network of shifting routes across a broad dispersal area, with the precise path changing according to rain, grass, water, disturbance and barriers. In its 2017 national corridor assessment (PDF), the Government of Kenya identified seven migratory routes or corridors within the Athi-Kapiti–Nairobi National Park landscape, reinforcing the point that connectivity depends on a permeable landscape rather than one line on a map.
In the 2013 peer-reviewed study by Ogutu and colleagues, the authors reviewed historical accounts showing that the connected population once ranged much farther than present-day Kitengela. Records describe movements north and northeast toward Ngong, Nairobi, Ruiru–Thika and Ol Donyo Sabuk, and an older range extending more than 100 kilometres north and hundreds of kilometres east. These references describe a broad former range, not one fixed annual loop followed by every animal.
The original seasonal pattern
| Seasonal phase | Typical wildebeest response | Main ecological function |
|---|---|---|
| Long and short rains | Herds dispersed south and southeast onto the Athi-Kapiti plains, depending on where rain produced usable forage and water. | Access to fresh grass, calving areas and a wider grazing landscape. |
| Early dry season | Animals progressively contracted toward reliable water and remaining forage. | Reduced exposure to drying seasonal water points. |
| Late dry season, often August–October | Large numbers historically concentrated in or near Nairobi National Park. | The park acted as a drought and dry-season refuge. |
| Exceptional drought or unusual rain | Timing, route and number entering the park could change sharply. | Shows that migration was rainfall-driven and flexible, not a fixed-date event. |
The 2013 analysis by Ogutu and colleagues found a statistically significant monthly migration pattern for wildebeest and plains zebra, with wildebeest most concentrated in the park during the late dry season and scarce there in many wet months.

What do the historic numbers actually show?
Published figures are often quoted without their survey area, season or method. That creates false comparisons. A count made inside the park in one month is not equivalent to an estimate for the entire Athi-Kapiti ecosystem, and early ground or reconnaissance counts are not directly interchangeable with later systematic aerial surveys.
| Period or year | Reported figure | What the number represents | How to interpret it |
|---|---|---|---|
| January 1948 | 1,814 | Wildebeest recorded in Nairobi National Park | Wet-season park count from an early historical survey. |
| September 1948 | 13,034 | Wildebeest recorded in Nairobi National Park | Late-dry-season park count; the contrast with January demonstrates strong seasonal concentration. |
| January 1948 | 96,800 | Wildebeest recorded on the wider Athi-Kapiti plains | Early estimate with a different spatial unit and historical method; useful for scale, not a modern census comparison. |
| September 1948 | 11,440 | Wildebeest recorded on the wider Athi-Kapiti plains | Complements the park’s September concentration and illustrates seasonal redistribution between the two areas. |
| Around 1978 | Nearly 30,000 | Estimated wider ecosystem population | Start of the modern long-term decline documented in aerial survey analysis. |
| 1978–1986 | About 16,000 on average | Wider ecosystem estimate | The population was already much smaller than the earliest historical estimates. |
| After 1997 | Below 6,000 | Wider ecosystem estimate | Marks the collapse to a much smaller residual population following continued fragmentation and drought. |
| Early 2010s | Around 5,000 | Wider ecosystem estimate in the 2013 peer-reviewed synthesis | Not the number living permanently inside the park. |
| 2020 management-plan baseline | About 200 using the park | KWS planning statement about animals using Nairobi National Park | A park-use figure, not a directly comparable estimate of all wildebeest across the wider ecosystem. |
The 1948 and long-term survey figures above come from the 2013 study by Ogutu and colleagues, which compiled and analysed the historical and aerial-survey evidence. The park-use statement comes from the KWS-approved Nairobi National Park Management Plan 2020–2030 (PDF).
The safest factual conclusion is therefore about magnitude and function, not one supposedly exact current total: the ecosystem lost most of its migratory wildebeest, and only a small proportion of the remnant population now uses the park. Any current number should be published with its date, season, survey boundary and method.
Why the migration collapsed
When and how did the migration collapse?
There was no single day when the migration stopped. It contracted in stages as the open rangeland became smaller and harder to cross.
- The former range shrank. By the mid-twentieth century, cultivation, settlement and other land uses had already eliminated northern and eastern extensions of the historic range.
- The remaining population became increasingly confined to Nairobi National Park and the Athi-Kapiti plains. This severed older connections with wildebeest farther south in Kajiado, Amboseli and northern Tanzania.
- Private subdivision and permanent barriers accelerated fragmentation. Former group ranches were divided into smaller parcels. More fences, buildings, quarries, farms and roads reduced both available habitat and the permeability of the land between habitat patches.
- The late 1990s and early 2000s exposed the loss of resilience. The 2013 analysis by Ogutu and colleagues showed that, after the 1997–98 wet period and the droughts that followed, park entries fluctuated from thousands to fewer than 100 in some years. Some animals shifted east toward ranches in Machakos rather than completing the former movement into the park.
- Residual movements became shorter and more constrained. A 2022 GPS-collar study by Stabach and colleagues analysed 12 Athi-Kapiti wildebeest tracked in 2010–2013. The animals continued to move, but none of those collared individuals crossed the tarmac Athi River–Namanga road, which bisected their seasonal range. Their maximum net displacement was about 38 kilometres, evidence of a compressed movement system rather than the former landscape-scale migration.
A 2019 research synthesis by Msoffe and colleagues estimated a fall from more than 26,800 wildebeest in 1977–78 to fewer than 3,000 in 2014. Because that paper is a preprint rather than a peer-reviewed final article, it is best treated as corroborating evidence rather than the sole source for a current population claim.

Why did Nairobi’s wildebeest migration decline?
1. Loss and fragmentation of the wet-season range
Land-use change is the dominant, best-supported cause. Wildebeest depend on access to different places at different times. Protecting only a dry-season refuge cannot preserve migration if the rainy-season range, calving grounds and connecting land are converted or blocked.
The most consequential changes south of the park include:
- subdivision and sale of former communal or large ranch lands
- wire, chain-link and solid perimeter fences around smaller properties
- rapid growth of Kitengela, Syokimau and Athi River
- housing, schools, shops, factories, flower farms, quarries and waste sites
- high-speed roads, rail and other linear infrastructure
- increasing traffic, people, dogs and livestock along former crossing areas.
A 2026 geospatial study by Maende, Agutu and Waithaka reported that, between 1994 and 2024, mapped built-up land in the Nairobi National Park–Kitengela–Athi-Kapiti corridor increased by 757% and agricultural land by 621%, while mapped grassland and shrub cover declined by 23%. These are relative changes within that study’s classification, not percentages of the total landscape.
2. Fences and dangerous crossings
Fences do more than remove grazing land. They can block a traditional path, funnel animals toward roads and settlements, trap herds during drought and make wildebeest vulnerable to illegal killing. Wildebeest are especially susceptible because a herd can be driven against a fence and prevented from escaping.
The national park itself is fenced on its northern, western and eastern sides. Its southern edge along the Mbagathi River remains only partly open. That southern permeability is therefore disproportionately important—but an open park boundary is useful only if connected land beyond it remains passable (Nairobi National Park Management Plan 2020–2030 (PDF)).
3. Poaching, harassment and human–wildlife conflict
Poaching was not merely an outcome of falling numbers; it helped accelerate the decline where animals were forced through predictable bottlenecks. Disturbance by vehicles, dogs and people also discouraged use of otherwise suitable land. Crop damage, competition with livestock and fear of predators reduced tolerance for wildlife on private land.
4. Drought and increasingly variable rainfall
Drought is a compounding pressure, not a complete explanation. A connected migratory system lets animals respond to patchy rain and find refuge. Fragmentation removes that option, so the same drought becomes more lethal. The severe droughts of the late 1990s and 2009 contributed to mortality and unusual distributions, but the long decline persisted across wet and dry years.
5. Livestock pressure, disease risk and changing forage
Higher livestock density was negatively associated with several wild herbivore populations in the long-term survey analysis. Competition for grass and water can matter locally, particularly in drought, although correlation alone does not prove that livestock caused the migration collapse.
A 2007 study by Bedelian and colleagues documented a specific pastoral concern: wildebeest can transmit the virus associated with malignant catarrhal fever to cattle. The risk can make livestock keepers avoid shared grazing areas during calving, increasing the social cost of coexistence. It is a management issue, but it does not explain the broad historical population collapse by itself.
Inside the park, high rainfall, tall rank grass and limited burning after very wet years can reduce the short, nutritious grazing preferred by wildebeest. Carefully controlled burning or mowing can improve a mosaic of short-grass habitat. However, park grass management cannot substitute for restoring the external seasonal range.
What did not cause the collapse on its own?
| Common explanation | Evidence-based correction |
|---|---|
| “Lions ate all the wildebeest.” | No. Long-term evidence does not support predation as the primary driver. Wildebeest and zebra are major lion prey, but their declines reflect habitat loss and restricted movement far more strongly. |
| “One fence closed the migration overnight.” | No. The collapse resulted from cumulative barriers and land conversion across decades, although individual fences can block critical local paths. |
| “The railway caused the whole decline.” | No. The decline was well advanced before the modern Standard Gauge Railway was built. Later infrastructure can add pressure, so functional crossings and long-term monitoring still matter. |
| “Drought alone killed the migration.” | No. Drought exposed and amplified a system already weakened by fragmentation. Historically, movement was the animals’ response to climatic variability. |
| “All wildebeest left Nairobi National Park.” | No. Wildebeest remain, but large, predictable seasonal aggregation and ecosystem-wide movement have been greatly reduced. |
The ecosystem today
Which animals used the migration landscape?
The corridor was never valuable to wildebeest alone. It supported an entire mobile savanna community.
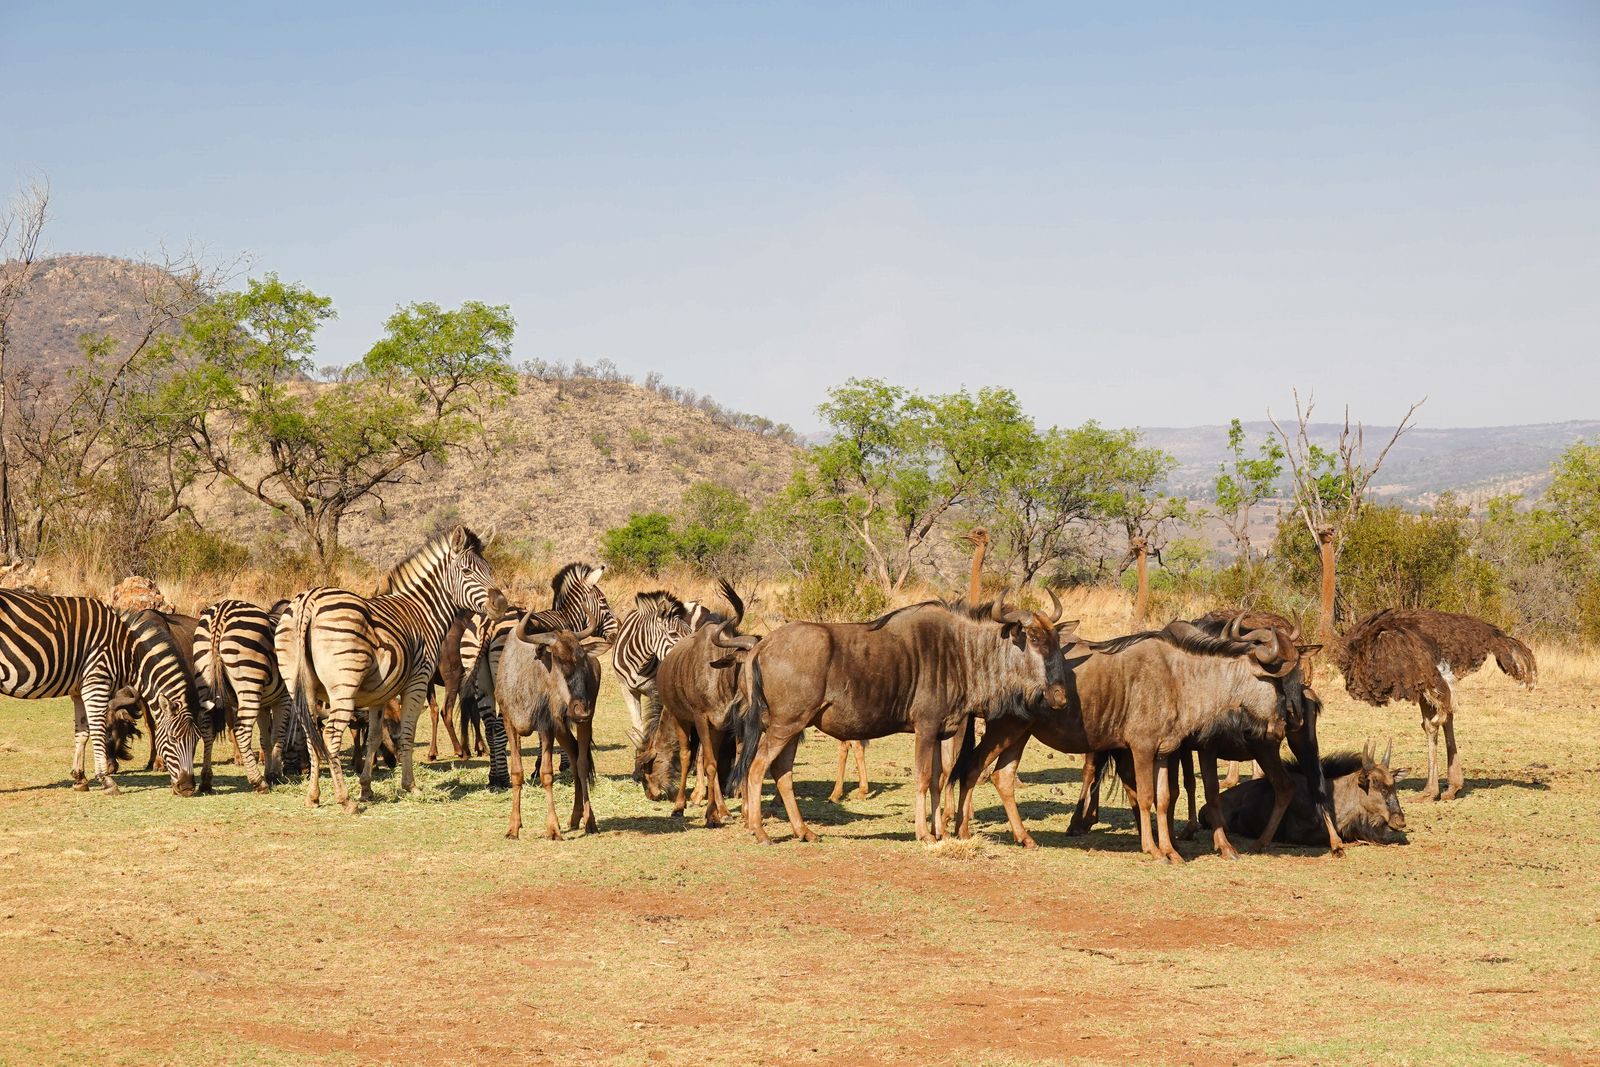
- Plains zebra showed the other clearest statistically significant monthly migration pattern. Zebra movements have persisted better than those of wildebeest, although they are also constrained.
- Eland, Coke’s hartebeest, Thomson’s gazelle and Grant’s gazelle used the wider dispersal landscape and shifted their distribution with forage, water and disturbance.
- Giraffe, buffalo and other large herbivores made seasonal or local movements through the same open areas, even where they did not follow the identical wildebeest pattern.
- Lions and other carnivores responded to prey distribution. When zebra and wildebeest moved beyond the park in wet periods, lions could follow, increasing contact with livestock and the risk of retaliatory killing.
This is why a wildlife corridor should be evaluated by the movements of multiple species, not by whether one wildebeest herd crossed a single point.
Why was the migration ecologically important?
Seasonal movement connected complementary habitats. Its loss affects more than the number of wildebeest visible to tourists.
| Ecological function | Why it matters |
|---|---|
| Access to seasonal forage and water | Animals could track rainfall and use fresh grass rather than overusing one small refuge. |
| Drought resilience | A large, connected range provided alternatives when one area failed. Barriers turn a local shortage into a population-level threat. |
| Predator–prey dynamics | Wildebeest and zebra supplied a major share of large-herbivore biomass and prey for lions and other carnivores. |
| Grassland processes | Mobile grazers cropped grass, redistributed nutrients and helped maintain spatially varied grassland conditions. |
| Population connectivity | Movement allowed animals to mix across the landscape, supporting demographic and genetic resilience. |
| Conflict avoidance | A planned, permeable corridor can direct animals away from dense settlement and unsafe crossings; unplanned bottlenecks concentrate conflict. |
| Tourism and identity | A functioning migration would strengthen the ecological integrity of the world’s best-known national park beside a capital city. |
For a closer look at the vegetation and water systems that support these animals, see Nairobi National Park habitats and ecosystem.
Where can wildebeest still move today?
The remaining movement opportunity lies mainly south and southeast of Nairobi National Park, not along one intact, legally secured route. Key parts of the landscape include the partly open Mbagathi River boundary, sections of Naretunoi Conservancy, the former Sheep and Goats Ranch, Kitengela and land extending toward Athi River and Machakos.
The KWS-approved management plan describes the former Sheep and Goats Ranch—about 2,912 acres of public land—as a critical unfenced dispersal area and calls for it to remain open. It also notes that some wildlife movement persists in the southeastern part of the ecosystem and that wildebeest have used the ranch as a calving area (Nairobi National Park Management Plan 2020–2030 (PDF)).
Yet “remaining corridor” must not be mistaken for “secure corridor.” A usable route needs:
- sufficient width and connected habitat
- safe access to forage and water
- wildlife-permeable property boundaries
- workable crossings at roads and rail
- low poaching and disturbance risk
- landholder support and compensation or benefits
- legal protection that survives future land sales and development.
Evidence from the 2022 GPS-collar study by Stabach and colleagues is especially sobering: none of the collared Athi-Kapiti wildebeest crossed the Athi River–Namanga tarmac road during the 2010–2013 tracking period. The animals were still moving, but within a much smaller and more constrained space.
Conservation and recovery

What is being done to conserve the corridor?
The Nairobi National Park Management Plan 2020–2030 (PDF) treats the park and its buffer zone as one ecological unit and proposes a combination of land protection, community partnership, monitoring, habitat management and law enforcement.
| Conservation measure | Intended result | Current interpretation |
|---|---|---|
| Conservation easements, leases and community conservancies | Keep private or community land open without requiring all of it to become a national park. | Essential, but agreements need durable funding, fair terms and long time horizons. A 2022 review by Mwangi and colleagues reported that a previous lease programme, begun in 2002, later ended after its funding became unsustainable. |
| Protection of Sheep and Goats Ranch and other public land | Prevent strategic public parcels from becoming barriers and anchor a southeast dispersal route. | Identified in the approved plan; protection on paper must be matched by enforceable land management. |
| Wildlife-friendly fencing and engineered crossings | Reduce collision, entrapment and severance by roads, rail and property boundaries. | Site selection should follow GPS data and post-construction crossing monitoring. |
| Community benefits and conflict mitigation | Make continued wildlife presence viable for landholders and livestock keepers. | Compensation, predator-proof bomas, rapid response and locally shared tourism value are part of corridor function, not optional extras. See human–wildlife conflict around Nairobi National Park. |
| Aerial counts, GPS collars and land-cover monitoring | Show whether animals can complete seasonal journeys and whether the population is recovering. | Counts must report season, survey boundary and method; movement data are as important as head counts. |
| Controlled burning, mowing and water management inside the park | Maintain a mosaic that includes short, nutritious grazing and reliable dry-season refuge. | Helpful within the park, but unable to replace lost external range. |
| Anti-poaching and coordinated land-use control | Reduce mortality and stop new bottlenecks before they become permanent. | Requires collaboration among KWS, county governments, communities, police, planners and infrastructure agencies. |
At national level, Kenya’s Cabinet directed faster implementation of migratory corridors and dispersal areas in the Athi-Kapiti ecosystem in November 2024 (Cabinet dispatch, 14 November 2024 (PDF)). In November 2025, the State Department for Wildlife announced approval of a three-year Nairobi National Park–Athi-Kapiti Wildlife Corridor project scheduled to begin in the 2026/27 financial year (official announcement). Reported components include land acquisition or securing land rights, wildlife-friendly fencing and road or rail crossings (The Star, 12 November 2025).
As of August 2026, approval and implementation activity should not be described as proof that the corridor has already been restored. Success must be demonstrated by protected land on the ground and repeated, safe animal movements—not announcements alone.
The broader local context, including habitat protection and community participation, is covered in the site’s Nairobi National Park conservation guide.
Can the wildebeest migration recover?
A more functional seasonal movement can recover, but the historic mass migration is unlikely to return through park management alone. Recovery depends on securing a connected route and sufficient wet-season habitat outside the 117-square-kilometre park before the remaining openings are built over.
The most meaningful indicators would be:
- more wildebeest crossing the southern boundary in both directions
- females and calves safely reaching wet-season habitat
- repeated use of road and rail crossings
- increased seasonal displacement recorded by collars
- lower fence entanglement, poaching and vehicle mortality
- stable or rising population estimates across the same survey area and season
- fewer livestock losses and retaliatory killings along movement routes
- legally secured corridor acreage that remains undeveloped over time.
A recovery programme should therefore measure movement function, not merely the number of animals present inside Nairobi National Park on one survey day.
What visitors should expect
Visitors can still see wildebeest in Nairobi National Park, often with zebra on open plains, but there is no guaranteed migration season or mass herd spectacle. Historic data indicate that the late dry season—especially August to October—once produced the largest concentrations in the park. Present-day distribution is less predictable because rainfall, barriers and disturbance alter where the remnant herds can go.
For current access, seasonal road conditions and wildlife-viewing advice, use the Nairobi National Park visiting guide and confirm same-day conditions with KWS or your guide. Population context belongs in the Nairobi National Park animal census trends guide.
Common questions
Frequently asked questions
Does wildebeest migration still happen in Nairobi National Park?
Only as a reduced remnant movement. Wildebeest still move within Nairobi National Park and the southeastern Athi-Kapiti landscape, but the former large, regular seasonal migration has functionally collapsed because its range and routes have been fragmented.
Are there still wildebeest in Nairobi National Park?
Yes. Wildebeest remain among Nairobi National Park’s herbivores, but the animals seen inside the park are a small and seasonally variable part of a much-reduced ecosystem population. Their continued presence should not be confused with survival of the historic migration at its former scale.
How many wildebeest are left?
There is no single current figure that responsibly represents both the park and the wider ecosystem. The 2013 peer-reviewed synthesis estimated around 5,000 in the wider ecosystem in the early 2010s, while the 2020 KWS management plan referred to about 200 using the park. Those figures cover different dates and areas and must not be treated as equivalent.
Where was the Nairobi wildebeest migration route?
The core movement connected Nairobi National Park with the Kitengela–Athi-Kapiti plains to the south and southeast, crossing the partly open Mbagathi boundary. It was a shifting network of routes and dispersal areas, not one permanent track.
What time of year did wildebeest enter Nairobi National Park?
Wildebeest historically concentrated in the park during the late dry season, commonly August–October, and dispersed onto the plains after rain. Actual timing varied with rainfall, water and forage, so it was never a fixed-date migration.
Why could the wildebeest not simply stay inside the park?
The park is too small to replace the full seasonal ecosystem. Wildebeest needed external rainy-season grazing and calving habitat, while the park supplied a better-watered dry-season refuge. Blocking either half removes the ecological logic of migration.
Did Nairobi National Park’s fence stop the migration?
The park is fenced on three sides, but the southern boundary remains partly open. The larger problem is the cumulative loss of permeability beyond that opening: private fences, settlements, industry and transport infrastructure have fragmented the plains the animals once used.
Do zebra still migrate through Nairobi National Park?
Zebra retain a clearer seasonal movement than wildebeest, and long-term surveys identified significant monthly migration for both species. Zebra are nevertheless exposed to the same shrinking dispersal area, barriers and conflict.
Is the migration connected to Maasai Mara or Serengeti?
No. Nairobi’s wildebeest belonged to the Athi-Kapiti movement system. It was separate from the Serengeti–Mara Great Migration and followed a much more local seasonal cycle.
What is the most important action for recovery?
Secure and reconnect enough land south and southeast of the park for safe, repeated seasonal movement. Habitat work inside the park, anti-poaching and monitoring are necessary, but they cannot restore migration without an external corridor and wet-season range.
The central finding
Conclusion
The answer to “What happened to the wildebeest migration in Nairobi National Park?” is not that every wildebeest vanished. The landscape that made migration possible was progressively divided, fenced, developed and made dangerous to cross. The surviving animals now move through a smaller, irregular and insecure system.
Nairobi National Park can remain a living savanna only if it stays ecologically connected to the Athi-Kapiti plains. Protecting the remaining southeastern dispersal land, building genuinely usable crossings, supporting landholders and measuring actual seasonal journeys would preserve more than one species: it would help sustain the wider community described in the Nairobi National Park animals guide.
Evidence reconstruction · Nairobi National Park
What Ogutu’s 1989–2011 ground counts reveal about Nairobi’s herbivores
This expert reconstruction combines the study’s published bimonthly count table with careful visual digitization of the fitted trend lines in Figure 5. It shows a catastrophic seasonal collapse for wildebeest, steep losses for warthog and waterbuck, and more varied U-shaped or recovering patterns for several resident species.
Executive reading
The decline is real—but it is not identical for every species
The reconstructed principal fitted trends indicate six clear declines from 1990 to 2011: wildebeest dry-season park use, zebra dry-season park use, Grant’s gazelle, impala, warthog and waterbuck. Buffalo increased; Thomson’s gazelle, hartebeest and eland ended near or above their early fitted levels after intervening lows, while giraffe finished broadly near its starting level.
Recreated charts
The fitted wildebeest break occurs around 2001–2002


Expert comparison
Estimated fitted change by species
These endpoints come from the smooth fitted lines, not the largest individual needles. Percentages are therefore best estimates from a raster chart and are rounded accordingly.
| Species | Series | 1990 fitted | 2011 fitted | Estimated change | Lowest fitted point | Interpretation |
|---|---|---|---|---|---|---|
| Wildebeest | Dry | 6,600 | 400 | -94% | 100 (2003) | Decline |
| Plains zebra | Dry | 2,500 | 1,400 | -44% | 1,400 (2010) | Decline |
| Thomson’s gazelle | All | 160 | 160 | +0% | 80 (2005) | Broadly Stable |
| Grant’s gazelle | All | 120 | 85 | -29% | 65 (2004) | Decline |
| Impala | All | 775 | 600 | -23% | 225 (2004) | Decline |
| Coke’s hartebeest | All | 500 | 625 | +25% | 400 (1994) | Increase |
| Eland | All | 155 | 185 | +19% | 90 (1998) | Increase |
| Giraffe | All | 125 | 120 | -4% | 70 (1997) | Broadly Stable |
| African buffalo | All | 250 | 300 | +20% | 110 (1998) | Increase |
| Common warthog | All | 60 | 40 | -33% | 10 (2003) | Decline |
| Common waterbuck | All | 65 | 15 | -77% | 10 (2002) | Decline |
Year-over-year estimates
Annual fitted trend table for all eleven species
Each cell shows the estimated fitted count and, beneath it, the absolute change from the preceding fitted year. For wildebeest and zebra this table uses the dry-season line; their wet-season estimates are separated below.
| Year | Wildebeest | Plains zebra | Thomson’s gazelle | Grant’s gazelle | Impala | Coke’s hartebeest | Eland | Giraffe | African buffalo | Common warthog | Common waterbuck |
|---|---|---|---|---|---|---|---|---|---|---|---|
| 1990 | 6,600 | 2,500 | 160 | 120 | 775 | 500 | 155 | 125 | 250 | 60 | 65 |
| 1991 | 6,500 ↓100 | 2,500 →0 | 130 ↓30 | 125 ↑5 | 725 ↓50 | 475 ↓25 | 145 ↓10 | 110 ↓15 | 220 ↓30 | 75 ↑15 | 50 ↓15 |
| 1992 | 6,200 ↓300 | 2,400 ↓100 | 110 ↓20 | 125 →0 | 675 ↓50 | 425 ↓50 | 135 ↓10 | 100 ↓10 | 200 ↓20 | 85 ↑10 | 40 ↓10 |
| 1993 | 5,800 ↓400 | 2,350 ↓50 | 100 ↓10 | 125 →0 | 625 ↓50 | 425 →0 | 125 ↓10 | 90 ↓10 | 180 ↓20 | 90 ↑5 | 35 ↓5 |
| 1994 | 5,500 ↓300 | 2,300 ↓50 | 100 →0 | 120 ↓5 | 600 ↓25 | 400 ↓25 | 115 ↓10 | 85 ↓5 | 160 ↓20 | 85 ↓5 | 30 ↓5 |
| 1995 | 5,100 ↓400 | 2,250 ↓50 | 100 →0 | 115 ↓5 | 550 ↓50 | 400 →0 | 105 ↓10 | 80 ↓5 | 140 ↓20 | 80 ↓5 | 25 ↓5 |
| 1996 | 4,800 ↓300 | 2,200 ↓50 | 105 ↑5 | 110 ↓5 | 525 ↓25 | 400 →0 | 100 ↓5 | 75 ↓5 | 130 ↓10 | 70 ↓10 | 20 ↓5 |
| 1997 | 4,400 ↓400 | 2,100 ↓100 | 110 ↑5 | 100 ↓10 | 475 ↓50 | 400 →0 | 95 ↓5 | 70 ↓5 | 120 ↓10 | 55 ↓15 | 20 →0 |
| 1998 | 4,100 ↓300 | 2,050 ↓50 | 110 →0 | 95 ↓5 | 450 ↓25 | 425 ↑25 | 90 ↓5 | 70 →0 | 110 ↓10 | 40 ↓15 | 20 →0 |
| 1999 | 3,700 ↓400 | 2,000 ↓50 | 115 ↑5 | 85 ↓10 | 400 ↓50 | 425 →0 | 90 →0 | 70 →0 | 110 →0 | 30 ↓10 | 15 ↓5 |
| 2000 | 3,400 ↓300 | 1,950 ↓50 | 110 ↓5 | 80 ↓5 | 350 ↓50 | 425 →0 | 90 →0 | 70 →0 | 120 ↑10 | 25 ↓5 | 15 →0 |
| 2001 | 2,500 ↓900 | 1,900 ↓50 | 105 ↓5 | 75 ↓5 | 300 ↓50 | 425 →0 | 95 ↑5 | 70 →0 | 130 ↑10 | 20 ↓5 | 15 →0 |
| 2002 | 200 ↓2,300 | 1,800 ↓100 | 95 ↓10 | 70 ↓5 | 275 ↓25 | 400 ↓25 | 100 ↑5 | 70 →0 | 150 ↑20 | 15 ↓5 | 10 ↓5 |
| 2003 | 100 ↓100 | 1,750 ↓50 | 90 ↓5 | 70 →0 | 250 ↓25 | 400 →0 | 105 ↑5 | 70 →0 | 160 ↑10 | 10 ↓5 | 10 →0 |
| 2004 | 100 →0 | 1,700 ↓50 | 85 ↓5 | 65 ↓5 | 225 ↓25 | 400 →0 | 115 ↑10 | 70 →0 | 180 ↑20 | 10 →0 | 10 →0 |
| 2005 | 200 ↑100 | 1,650 ↓50 | 80 ↓5 | 65 →0 | 225 →0 | 400 →0 | 125 ↑10 | 75 ↑5 | 190 ↑10 | 10 →0 | 10 →0 |
| 2006 | 200 →0 | 1,650 →0 | 80 →0 | 65 →0 | 250 ↑25 | 425 ↑25 | 140 ↑15 | 80 ↑5 | 210 ↑20 | 10 →0 | 10 →0 |
| 2007 | 200 →0 | 1,600 ↓50 | 85 ↑5 | 65 →0 | 250 →0 | 450 ↑25 | 150 ↑10 | 85 ↑5 | 220 ↑10 | 10 →0 | 10 →0 |
| 2008 | 300 ↑100 | 1,500 ↓100 | 95 ↑10 | 70 ↑5 | 300 ↑50 | 475 ↑25 | 160 ↑10 | 90 ↑5 | 240 ↑20 | 15 ↑5 | 10 →0 |
| 2009 | 300 →0 | 1,450 ↓50 | 110 ↑15 | 75 ↑5 | 375 ↑75 | 500 ↑25 | 170 ↑10 | 100 ↑10 | 260 ↑20 | 20 ↑5 | 15 ↑5 |
| 2010 | 300 →0 | 1,400 ↓50 | 130 ↑20 | 80 ↑5 | 500 ↑125 | 550 ↑50 | 175 ↑5 | 110 ↑10 | 280 ↑20 | 30 ↑10 | 15 →0 |
| 2011 | 400 ↑100 | 1,400 →0 | 160 ↑30 | 85 ↑5 | 600 ↑100 | 625 ↑75 | 185 ↑10 | 120 ↑10 | 300 ↑20 | 40 ↑10 | 15 →0 |
Migration signal
Wildebeest fitted trends by season
| Year | Dry fitted estimate | Dry YoY change | Wet fitted estimate | Wet YoY change |
|---|---|---|---|---|
| 1990 | 6,600 | — | 100 | — |
| 1991 | 6,500 | -100 | 300 | +200 |
| 1992 | 6,200 | -300 | 700 | +400 |
| 1993 | 5,800 | -400 | 1,100 | +400 |
| 1994 | 5,500 | -300 | 1,300 | +200 |
| 1995 | 5,100 | -400 | 1,200 | -100 |
| 1996 | 4,800 | -300 | 1,000 | -200 |
| 1997 | 4,400 | -400 | 900 | -100 |
| 1998 | 4,100 | -300 | 700 | -200 |
| 1999 | 3,700 | -400 | 600 | -100 |
| 2000 | 3,400 | -300 | 400 | -200 |
| 2001 | 2,500 | -900 | 200 | -200 |
| 2002 | 200 | -2,300 | 0 | -200 |
| 2003 | 100 | -100 | 0 | +0 |
| 2004 | 100 | +0 | 0 | +0 |
| 2005 | 200 | +100 | 0 | +0 |
| 2006 | 200 | +0 | 0 | +0 |
| 2007 | 200 | +0 | 100 | +100 |
| 2008 | 300 | +100 | 100 | +0 |
| 2009 | 300 | +0 | 100 | +0 |
| 2010 | 300 | +0 | 100 | +0 |
| 2011 | 400 | +100 | 100 | +0 |
The main signal is not a gentle twenty-year decline. The dry-season fit drops from roughly 6,600 animals around 1990 to around 3,400 in 2000, then approaches the baseline by 2002. The wet-season fit also collapses. This supports the study’s conclusion that dependence on Nairobi National Park as a dry-season refuge had essentially broken down.
Observed counts
Annual summaries of the published wildebeest and zebra needles
Means summarize the available bimonthly observations within each calendar year; ranges preserve the substantial seasonal variability that an annual average conceals.
| Year | Wildebeest mean | Wildebeest range | n | Zebra mean | Zebra range | n |
|---|---|---|---|---|---|---|
| 1990 | 2,040 | 0–9,742 | 8 | 529 | 0–2,566 | 8 |
| 1991 | 1,780 | 10–8,247 | 6 | 1,096 | 0–2,886 | 6 |
| 1992 | 2,756 | 49–6,115 | 5 | 1,484 | 0–2,957 | 5 |
| 1993 | 4,100 | 39–7,856 | 3 | 1,602 | 10–2,671 | 3 |
| 1994 | 2,288 | 0–6,774 | 6 | 1,196 | 15–2,583 | 6 |
| 1995 | 1,430 | 0–5,735 | 6 | 686 | 5–2,248 | 6 |
| 1996 | 3,227 | 8–7,676 | 6 | 1,342 | 131–2,775 | 6 |
| 1997 | 2,364 | 89–6,939 | 5 | 1,986 | 175–4,041 | 5 |
| 1998 | 195 | 2–703 | 4 | 684 | 2–1,454 | 4 |
| 1999 | 775 | 7–1,815 | 6 | 1,208 | 44–2,791 | 6 |
| 2000 | 2,537 | 0–5,429 | 6 | 2,241 | 889–3,415 | 6 |
| 2001 | 20 | 0–73 | 6 | 464 | 58–2,168 | 6 |
| 2002 | 22 | 0–64 | 6 | 454 | 9–1,403 | 6 |
| 2003 | 16 | 0–97 | 6 | 371 | 4–1,639 | 6 |
| 2004 | 108 | 16–249 | 6 | 902 | 93–3,097 | 6 |
| 2005 | 285 | 23–799 | 6 | 1,479 | 160–2,206 | 6 |
| 2006 | 228 | 10–707 | 6 | 1,300 | 45–3,154 | 6 |
| 2007 | 94 | 35–169 | 6 | 961 | 195–2,146 | 6 |
| 2008 | 91 | 0–160 | 6 | 728 | 70–1,294 | 6 |
| 2009 | 405 | 251–517 | 6 | 1,722 | 1,192–2,385 | 6 |
| 2010 | 114 | 12–237 | 6 | 1,058 | 212–1,982 | 6 |
| 2011 | 180 | 108–243 | 3 | 805 | 685–959 | 3 |
Method and limitations
How these estimates were reconstructed
Published observations
The vertical needles come from Supplementary Material E, which lists attempted total-area ground counts for 125 survey occasions. Blank cells are retained as missing, not silently converted to zero. Two evident survey-index ordering anomalies were aligned to the common cross-species calendar without changing their dates or counts; omitted warthog and waterbuck survey slots are explicit missing rows in the source CSV.
Digitized fitted lines
The annual 1990–2011 values were read from the original 300 dpi Figure 5 rendering by calibrating every panel to its printed year and population ticks, isolating the fitted-line colors, and interpolating the curve at each year.
What the study fitted
Ogutu and colleagues used a multivariate semiparametric generalized linear mixed model with a negative-binomial error distribution, log link and penalized cubic B-splines. The solid curves are model estimates—not annual censuses or straight lines through the observations.
Confidence limits
The original cyan ribbons are 95% pointwise confidence bands. Their visible upper and lower edges were digitized at annual positions for the nine combined-species panels and are included as approximate bounds in the CSV. Seasonal ribbons for wildebeest and zebra could not be separated reliably from the source raster, so those fields remain blank and no seasonal bands were invented. The published figure remains the authority for uncertainty.
Primary source
Credit Ogutu and the full study team
Joseph O. Ogutu, Norman Owen-Smith, Hans-Peter Piepho, Mohammed Y. Said, Shem C. Kifugo, Robin S. Reid, Helen Gichohi, Paula Kahumbu and S. Andanje published Changing Wildlife Populations in Nairobi National Park and Adjoining Athi-Kaputiei Plains: Collapse of the Migratory Wildebeest in The Open Conservation Biology Journal, Volume 7, pages 11–26, in 2013.
The study reports that KWS staff and volunteers conducted the ground counts using a consistent block-based vehicle-count protocol. Its interpretation emphasizes the interdependence of the park and the adjoining plains, with wildebeest especially vulnerable to change in their wet-season dispersal range.
Evidence base
Research and further reading
- Ogutu, J. O. et al. (2013). Changing Wildlife Populations in Nairobi National Park and Adjoining Athi-Kaputiei Plains: Collapse of the Migratory Wildebeest. Core peer-reviewed source for long-term aerial trends, seasonality and causal interpretation.
- Kenya Wildlife Service (approved plan, 2020–2030). Nairobi National Park Management Plan (PDF). Official management baseline, corridor threats and proposed responses.
- Stabach, J. A. et al. (2022). Increasing Anthropogenic Disturbance Restricts Wildebeest Movement. Peer-reviewed GPS evidence from Athi-Kapiti, Amboseli and Mara wildebeest.
- Ojwang’, G. O. et al. (2017). Wildlife Migratory Corridors and Dispersal Areas: Kenya Rangelands and Coastal Terrestrial Ecosystems (PDF). Government assessment of Kenya’s corridor network.
- Mwangi, D. K. et al. (2022). Development challenges and management strategies on the Kenyan National Park System: A case of Nairobi National Park. Peer-reviewed review of urban development pressure and management options.
- Maende, E., Agutu, N. & Waithaka, E. (2026). Spatiotemporal Pattern Analysis of Wildlife Migration Corridors: Nairobi National Park–Kitengela–Athi-Kapiti Plains. Recent land-cover and corridor analysis covering 1994–2024.
- Bedelian, C. et al. (2007). The impact of malignant catarrhal fever on Maasai pastoral communities in Kitengela. Evidence on a specific livestock–wildebeest coexistence cost.